

Market Moves
By Omkar Godbole
With each passing week, bitcoin’s blockchain metrics diverge from bearish macroeconomic factors, offering hope to long-term holders.
The number of coins held on exchanges declined by more than 20,000 BTC to 2,449,785 BTC last week, hitting the lowest since August 2018, data provided by blockchain analytics firm Glassnode shows. The tally has decreased by 138,266, or 5%, this year, indicating HODLing – a crypto slang for buy and hold – remains a preferred strategy in the market.
Investors typically take direct custody of coins when intending to hold them for a long term. A continued decline in BTC available on exchanges means fewer coins available for sale and the potential for an extended rally.
”Underneath the surface, there is a heavy phase of accumulation on-chain,” Blockware Solutions’ market intelligence newsletter published on Friday said. ”Exchange outflows have reached a rate that has only ever occurred three times before in bitcoin’s history: following March 2020, December 2020 (a lot of which was likely GBTC) and September 2021.”
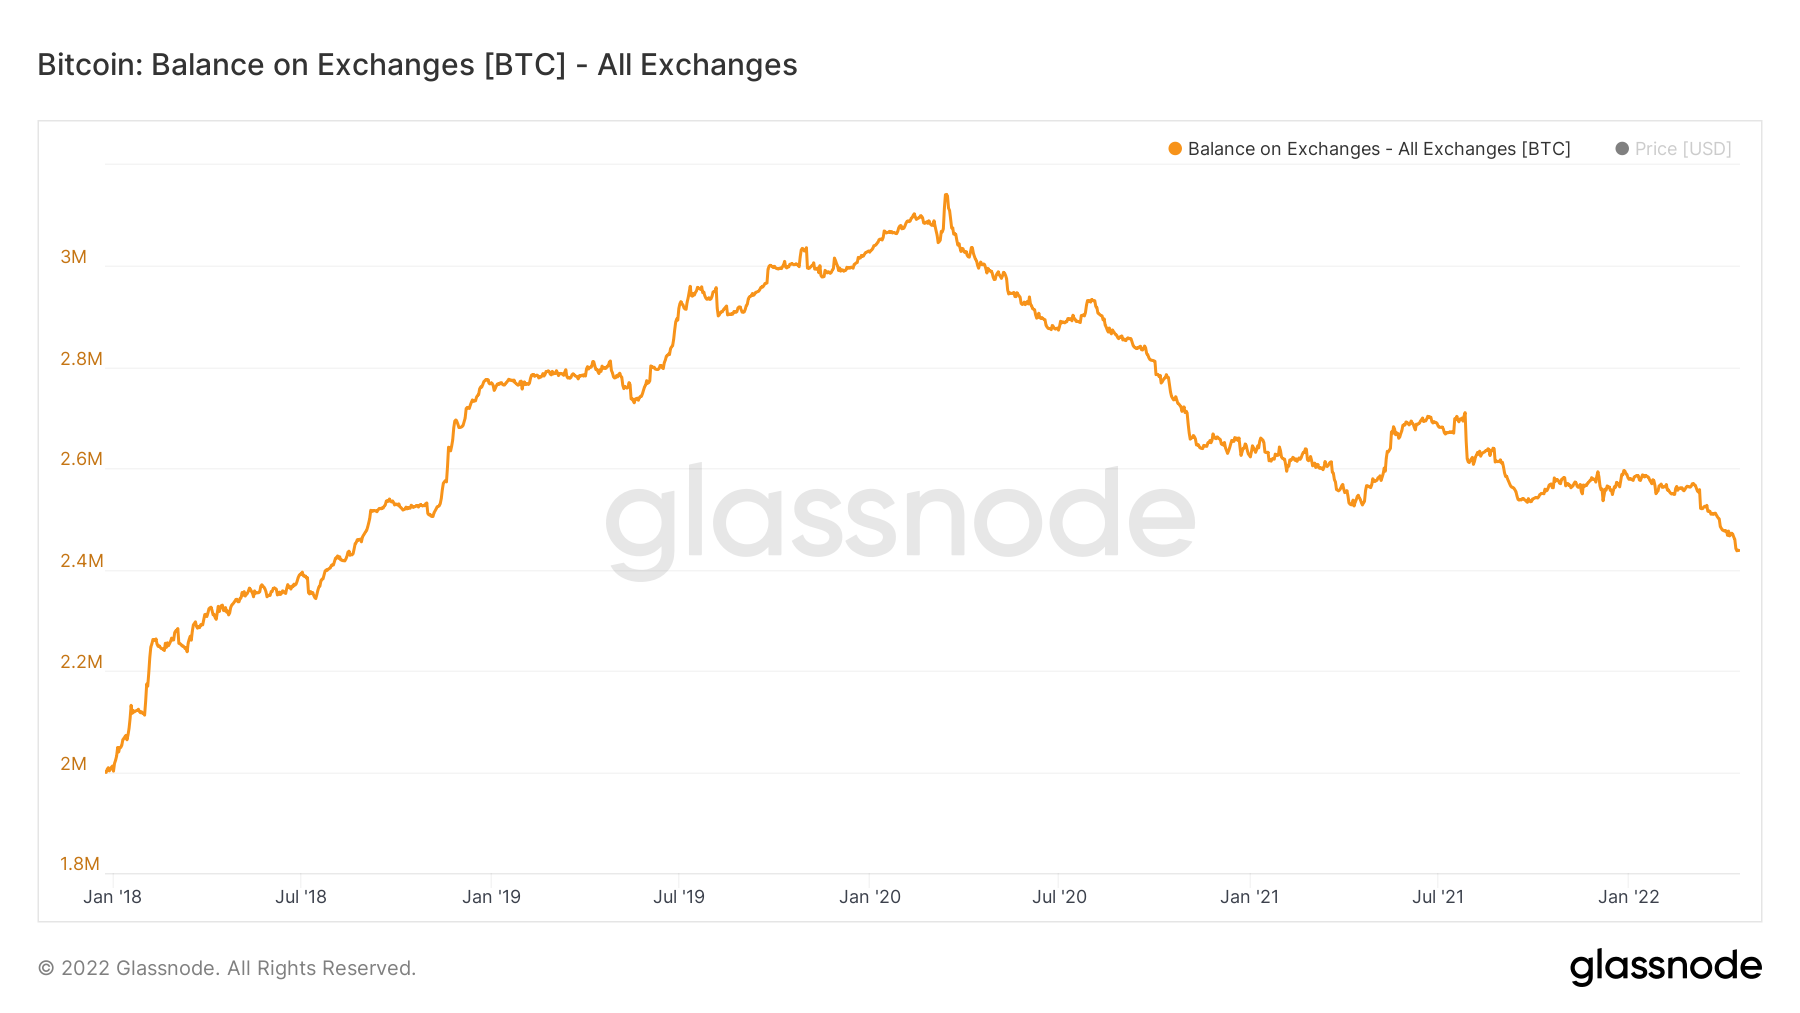
Bitcoin’s exchange balance
Other metrics also paint a bullish picture. For instance, the percentage of bitcoin inactive for at least a year recently reached a record high of 63.7%. At the same time, whales (large investors) accumulated 1,000 BTC last week, registering the first weekly uptick since January, according to Blockware Solutions.
Even so, bitcoin fell to a one-month low of $38,577 during Asian trading hours, taking the year-to-date decline to over 15%. The selling pressure likely stemmed from tax issues and macro traders liquidating holdings, tracking a continued melt-up in government bond yields and likely tightening by the Federal Reserve.
Clearly, macro factors are in the driver’s seat. ”For now, we’ll continue to listen to every sound bite from Fed officials as they look to combat inflation via scare tactics,” Jeff Dorman, chief investment officer at Arca, a crypto investment firm, noted last week. ”But one year from now, it’s doubtful that the high correlation between rates, equities and digital assets will be anything besides another footnoted relationship that didn’t hold.”
Bitcoin at key support
Bitcoin’s three-day chart, where each candle represents price action for three days, shows the cryptocurrency is flirting with the 200-period simple moving average (SMA). That’s a critical level to watch out for, given that bears have repeatedly failed to establish a foothold under the technical line since late January.
Should they succeed this time, more chart-driven selling may be seen. A breakdown would expose support at $30,000. The current three-day candle is set to close at 23:59 UTC on Monday.
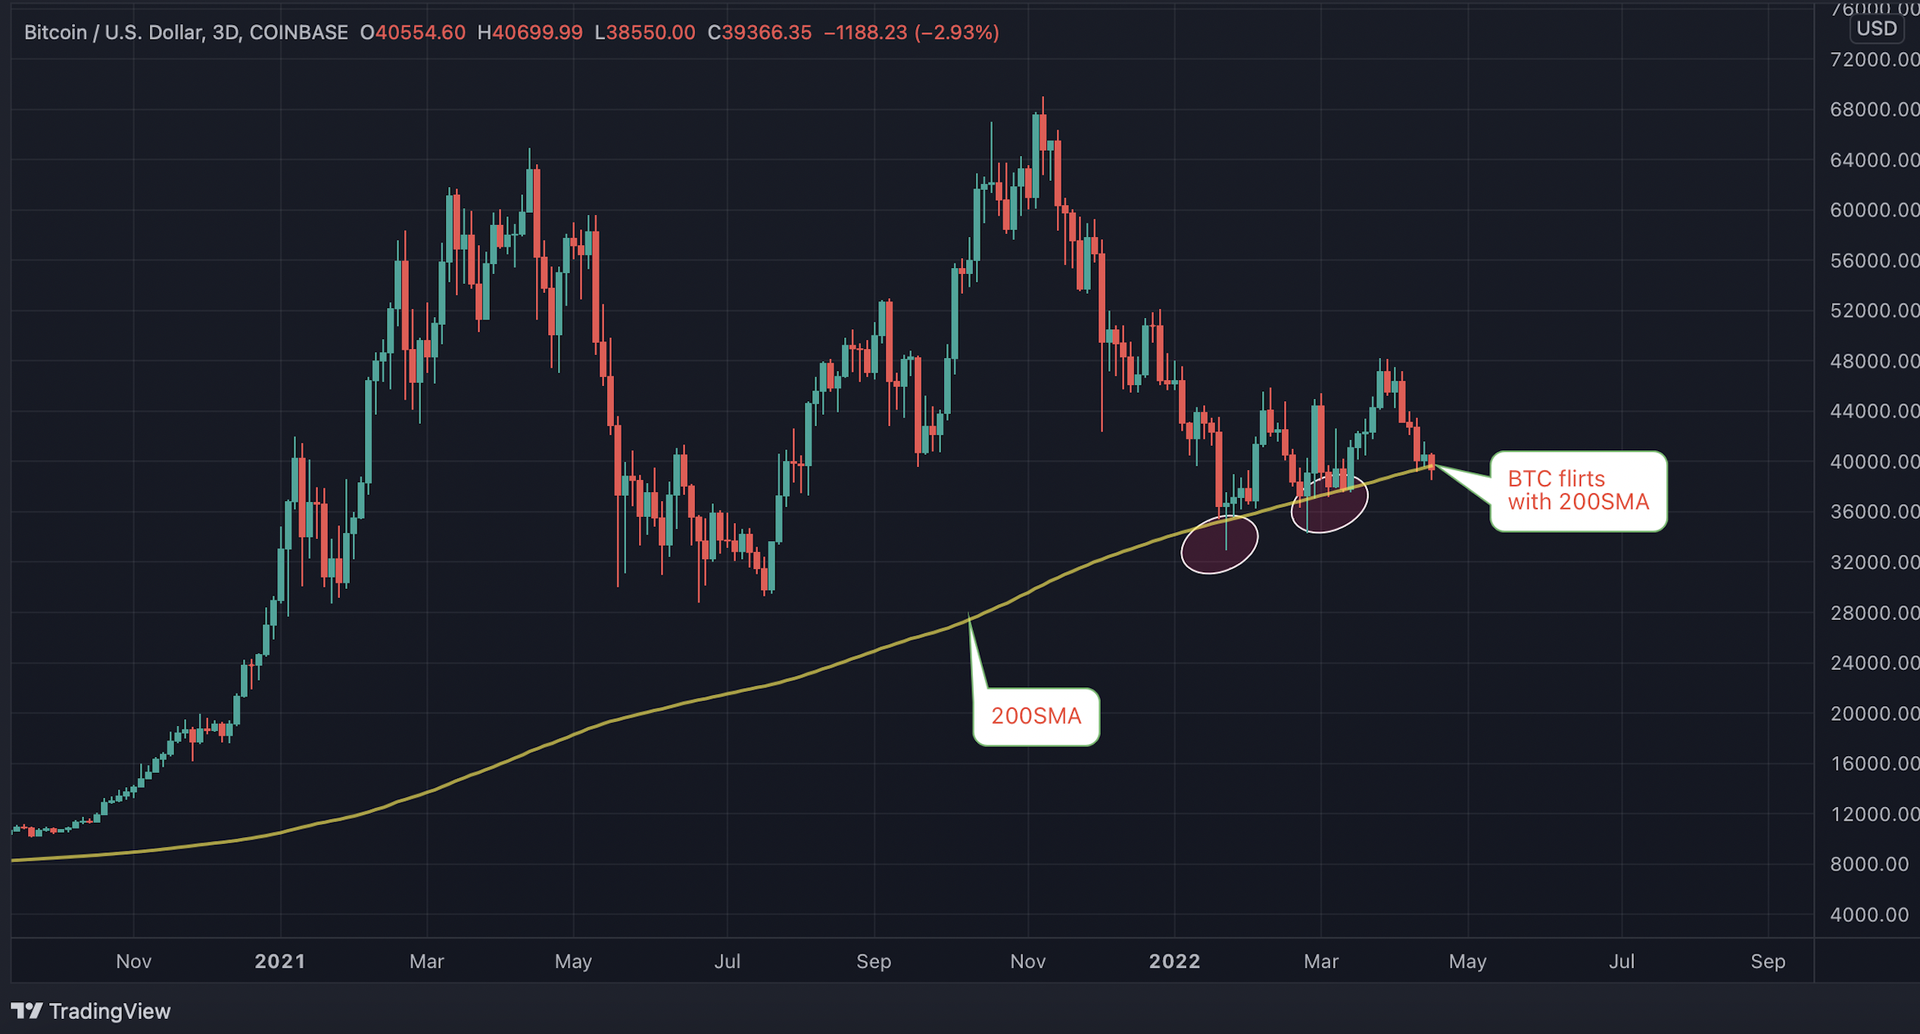
Bitcoin’s three-day chart (TradingView)
Source: Coindesk.com
Featured image from Shutterok/Getty Images